Covid-19 is one of the biggest challenges of the 21st century. It has taken many lives and has devastated more companies than we can count. But how did it affect the traffic? Has the number of injuries on the street of New-York decreased during the pandemic? Are the bicyclist and pedestrians safer than before, or vice versa? Well, it’s complicated. Today, we’ll take a look at the coronavirus from a specific angle.
We’ll talk about the dramatic changes that have happened in New York during the fight with this deadly virus. As you might’ve already guessed, the total number of collisions has dropped significantly: the year-to-date difference compared to the same period in 2019 is ~50%. Unfortunately, the death rate has unexpectedly increased. Why is that? What are the numbers telling us?
What has Actually Happened?
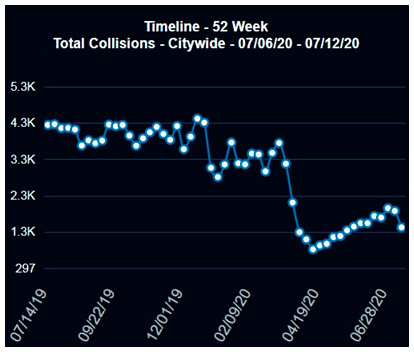
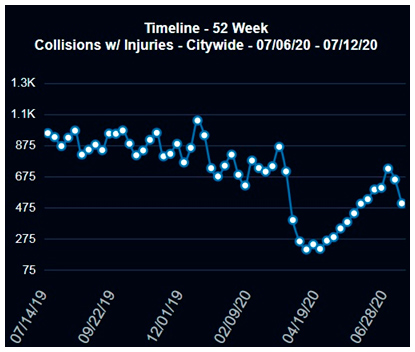
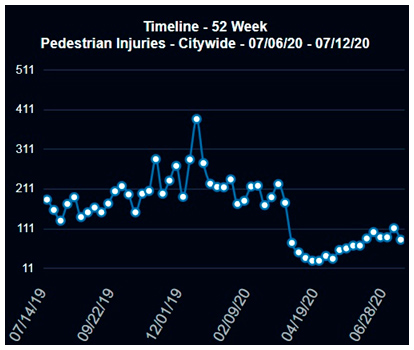
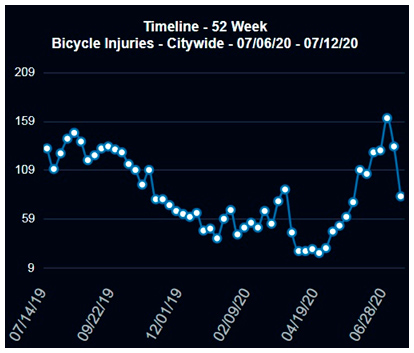
Our experts turned to the NYPD Traffic Stat for accurate information on the situation. They collected data on the number of total collisions and collisions with injuries, along with pedestrian and bicycle injuries. Take a good look at the charts: the timelines clearly show the changes that took place in late March/early April. The reason: on March 22, Governor Cuomo issued an executive order in an attempt to battle Covid-19.
The “New York State on PAUSE” ten-point policy closed all non-essential businesses (statewide). Furthermore, it limited outdoor activities, the use of public and personal transport, and more. As a result, NY witnessed a significant decrease in the number of vehicles on the streets. Let us talk about that in more detail.
The City of New York: the Impact
After the NY State on PAUSE policy, the number of total collisions plummeted. But, it started to slowly go up after the lockdown lift
Here are the official statistics: vehicle miles traveled in NY have dropped by 80% during the lockdown. The first lowering was recorded on March 15. That’s when the politicians started talking about the importance of staying at home. On the 8th, the number of total collisions was 3742; on the 15th, it decreased to 3173. On the 22nd, that number was cut by 33% (2104). On the 29h, the city cameras only captured 1286 collisions.
The situation with the collisions with injuries was almost an exact match. The first significant drop in the number of cases occurred on March 15.
The city recorded fewer collisions with injuries on March 15 compared to the beginning of the month, with the number dropping to 205 (the lowest low) on April 5
As for the bicycle injuries, on March 15, there were 89 recorded cases against 77 on the 8th and 54 on the 1st. On the 22nd, the chart did, eventually, go down.
This is important: during these tough times, the city of New York has registered more speeding tickets than last year. The stay-at-home order isn’t very easy to follow, and in an attempt to get things done the way they used to, people are driving fast, putting others in danger. That partially explained the situation with pedestrian injuries. They have only decreased by 58% during the first month of the government-initiated lockdown.
The pedestrian injuries chart shows a less obvious decline than expected. And, it didn’t change much after the city reopened
Mayor de Blasio promised a tough response to this, and traffic cameras are doing their job. But, New-Yorker’s aren’t quick to slow down and commit to the speed limits set by the city.
The Death Rate: Why is It Higher during the Pandemic?
As we just mentioned, regular drivers are exceeding the speed limits during the pandemic. And while the number of crashes is hitting rock bottom, the rate is alarmingly high. That’s why the fatalities haven’t declined nearly as much as you’d expect. In fact, the state of New-York has seen a disturbing increase in traffic deaths (17%). The situation is even worse in Louisiana (23%) and California (43%).
That proves that the empty roads weren’t as safe during the lockdown as the officials thought they’d be. Statistics showed a 14% year-to-year increase in the fatality rates per mile in the United States. We’re talking about March and April of 2020. A large number of US citizens died during the holiday weekends. While the number of fatalities was the lowest since 2014, it should’ve been significantly lower.
Lockdown Lift: the Impact
On July 20, the city entered the fourth (and, hopefully, final) stage of the reopening process. New York spread its wings exactly 100 days after the pandemic started, and that breathed life back into the great city. But it also led to some unforeseen consequences. The biggest “spike” of injuries was recorded among the fans of bicycles. On April 19, only 24 bicycle injuries happened. In contrast, on June 28, that number skyrocketed to 162.
The lockdown decreased the number of bicycle injuries. However, it spiked shortly after July 20 when the fourth stage of the reopening came into effect
It did, of course, drop soon (82 injuries on July 12), but not before hurting a lot of people. Many regional officials have stated that after the lockdown was raised, people quickly forgot about traffic regulations. It’s also worth mentioning that the number of pedestrian/cyclist deaths by car accidents has increased over the last two years, way before the coronavirus hit the United States.
The EndLine
With New-York (both the state and the city) suffering a new wave of coronavirus infection, there’s no telling how the situation will change in the nearest future. People are losing patience, saying goodbye to loved ones, and running out of dollars – everything could take an even more drastic turn than after the March 22 lockdown. We might see more speeding tickets, more crashes, and a higher death toll. The riots in the Big Apple can also worsen the situation.
The first responders and the healthcare workers still have their hands full, and they simply can’t handle all these new car crashes. They should focus on battling the virus, not careless drivers. So, drive consciously, be careful when crossing the street, and don’t leave your home unless you really have to! We’ll keep our eye on the course of events and tell you about all the latest developments.
All charts are courtesy of NYPDonline.org


Add Comment